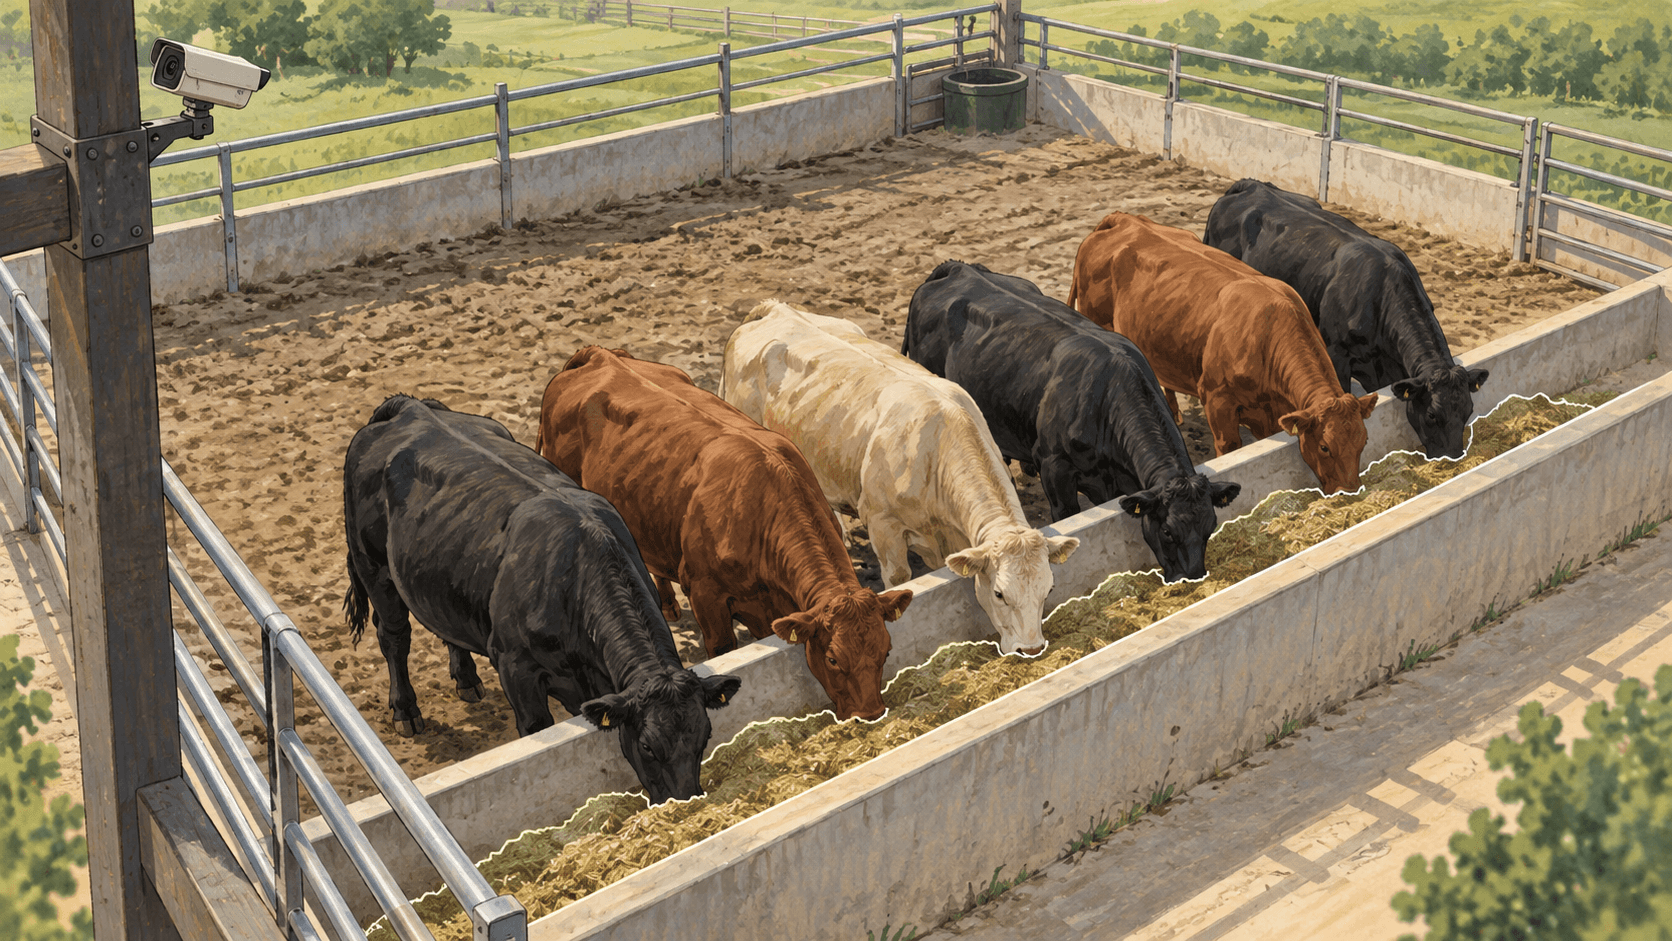
What the 183 images were used to classify
The Texas A&M-authored paper describes a feed-bunk case using transfer learning with a ResNet backbone. Transfer learning starts with a model that has already learned general image patterns, then adapts it to a narrower task. Here, that task was assigning one of six customized feed-grade labels, identified as S00 through S40.
The paper reports 183 labeled images for that model and 91% accuracy on an independent verification set of 7,905 images. “Accuracy” is the share of predictions that matched the reference labels in that evaluation. It describes this classification result; it does not say how much feed cattle consumed, whether a ration was nutritionally adequate, or what another site would achieve.
Read the Journal of Animal Science paper for its full methods and definitions. The published case is useful because it makes the task, the number of labeled examples, and the separate evaluation set visible—not because 183 is a recipe for every cattle-image project.
Why a small labeled set is not the whole evaluation
Labels are examples that tell a model what an image represents. A small, carefully defined set can be useful when images are consistent and the model can reuse patterns learned elsewhere. The difficult work is agreeing on the grade boundaries, labeling images consistently, and testing whether the model handles new images rather than memorizing familiar ones.
A researcher reading any such result should check how images were assigned to training and verification sets, whether examples from the same pen, day, camera, or bunk could appear on both sides, and how performance varies across the six grades. A single overall percentage can hide a grade that is much harder to classify or a class distribution that favors common labels.
The separate 7,905-image verification set matters because it is distinct from the 183 labeled training images. But the size of a set alone does not establish transfer to a different camera angle, ration, lighting condition, feed material, or facility. Those conditions should be checked against the target study and its intended use.
Keep a visual grade separate from feed intake
A model that sorts images into visual feed-grade categories answers a classification question: which defined label best matches this view? It does not automatically turn pixels into kilograms consumed. Intake requires a direct measurement and a study method that links that measurement to cattle, pens, and time.
For example, a team might use a visual grade to decide which time windows deserve closer review, while electronic feeder weights provide the intake outcome. The grade and weight can be analyzed together only after the team defines how the images, feeder records, and experimental units connect.
The useful next question is not simply “How many pictures?” It is whether the labeled examples represent the range of conditions where the model will be used, and whether the evaluation keeps genuinely new examples separate from the examples used to adapt it.
What a camera platform contributes to this research
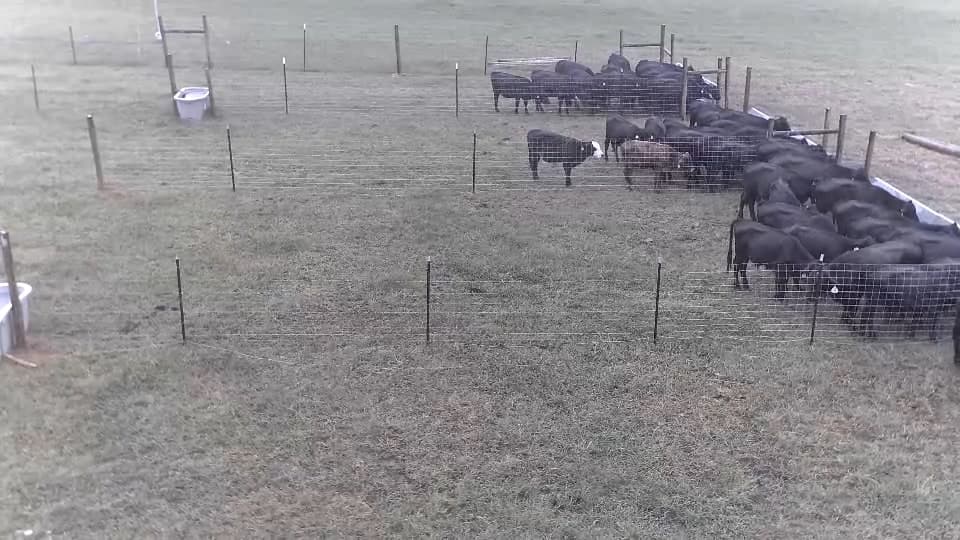
At Tuskegee University, the documented Livestock Technologies installation records fixed RGB and thermal views around four research pens, with solar field nodes, wireless backhaul, and on-site processing and storage. Researchers can inspect the actual bunk view to see the kind of field context the installation preserves.
A field platform contributes capture, reviewable source footage, and local handling of research data. A new project still needs its own outcome definition, image-labeling rules, reference measurements, analysis, and checks on the conditions where a model is expected to work.
For project scoping, share the ungated research capabilities brief, inspect the documented Tuskegee field results and the full deployment report, or review the camera and field-data platform. University teams can also find the research audience page.
Never lose an animal.
Start with the image question your team needs to answer.
Bring your target labels, field conditions, and reference measure. Livestock Technologies can walk your team through the installed Tuskegee platform and discuss a fit-for-study field scope.
Discuss a university research project →