Start with what the study measured
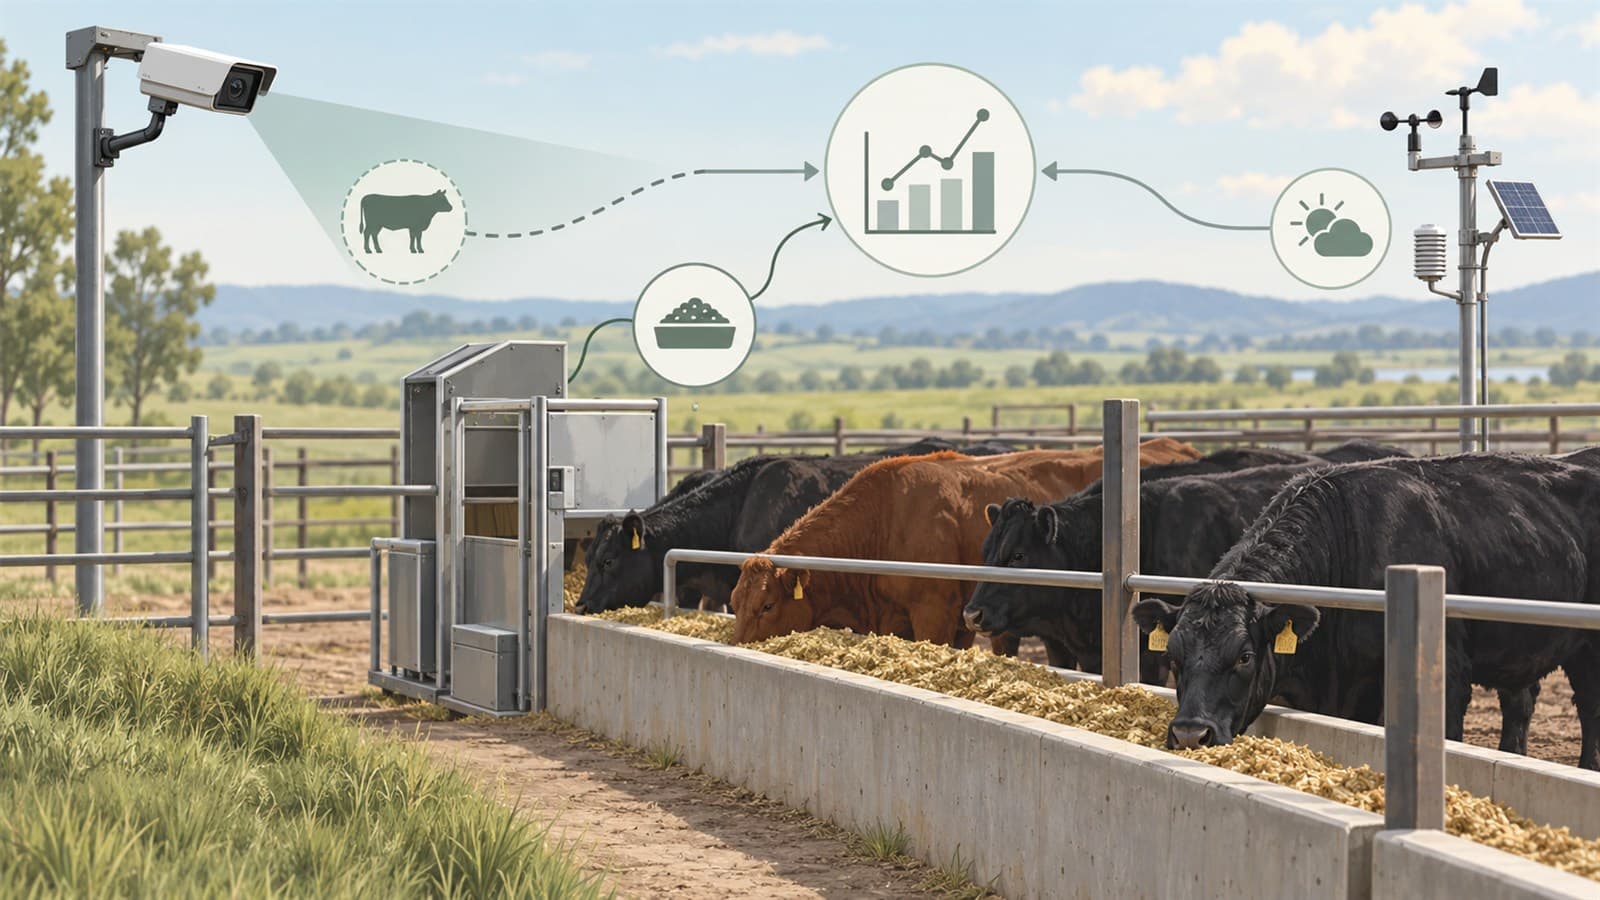
The University of Idaho team built its models around electronic-feeder records. Those records included intake amount, feeding duration and timestamps; the researchers paired them with weather data across 19 experiments at an Idaho research-feedlot facility between 2013 and 2024.
That distinction matters when you design a computer-vision study. A camera may show where cattle are, how they move around a bunk and when activity changes. A feeder record supplies the quantity needed to train or evaluate a model that predicts intake.
What the 2026 feedlot study found
The open-access paper reports more than 16.5 million electronic-feeder samples. The authors grouped closely spaced feeding events into meals, cleaned outliers, and tested environmental inputs such as temperature, humidity, wind, sunlight and precipitation.
One weather-based comfort index was useful for predicting thermal comfort but had limited ability to predict feed intake. A second index combined weather with feeding behavior and supported intake prediction. The best reported XGBoost model had a root mean squared error (RMSE) of 1.38 kilograms per day for animal-level predictions and 0.14 kilograms per day per animal for pen-level predictions.
RMSE describes the size of prediction errors in this study; these figures are results from its research setting, not performance targets for a different herd, diet or facility. The paper is useful because it names the inputs and reports results separately at the animal and pen levels.
Read AI-based framework to predict animal and pen feed intake in feedlot beef cattle in Smart Agricultural Technology, or see the University of Idaho research record.
Where cattle video fits
At Tuskegee University, Livestock Technologies has installed fixed color (RGB) and thermal camera views around four research pens, with solar-powered field nodes, wireless links, and on-site processing and storage. The field report shows the installation; the university capabilities brief summarizes the platform researchers can discuss with our team.
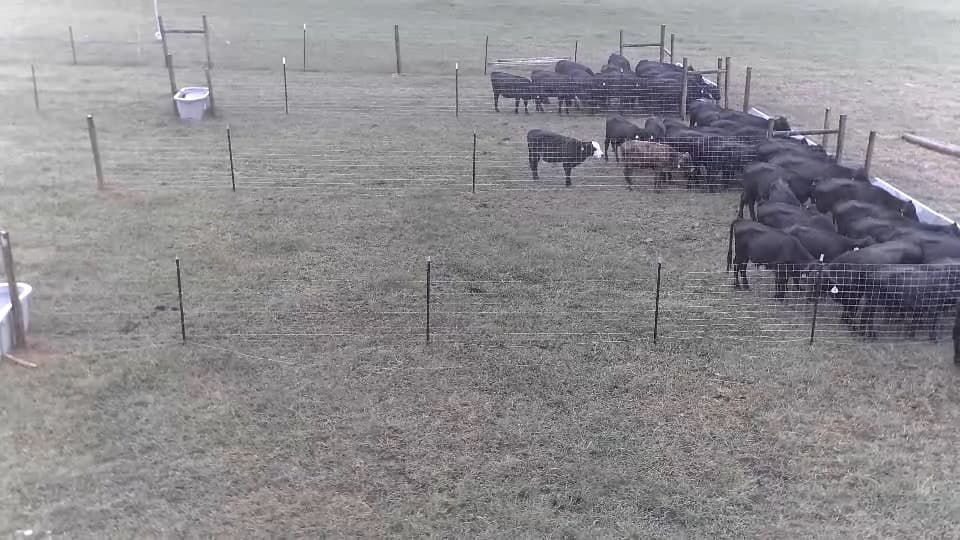
In a study that also has direct feeder measurements, video can help researchers interpret the conditions around those measurements—for example, access to the bunk, visible crowding or changes in activity. The study team would specify how camera timestamps, feeder records, weather and animal or pen identifiers should align.
That is the useful role of a field imaging platform: preserve a view of what was happening so investigators can ask a more grounded question of the measurements they collect.
A practical question for a university project
Consider a team asking whether visible bunk activity changes alongside measured intake during periods of different weather. Before collecting data, the researchers can name the outcome to predict, choose the feeder record that measures it, and decide whether the analysis unit is an animal or a pen.
Then they can determine which camera views and time windows make the activity interpretable, what weather source is available, and which animals or dates should be held aside for an independent check. These choices turn “use AI on cattle video” into a study with defined inputs, a measurable target and a result another team can understand.
Livestock Technologies can show the documented Tuskegee setup and discuss camera coverage, field connectivity, local processing and data storage for a proposed project. Any feeder integration, measurements and research methods would be scoped with the university team.
For the wider system overview, visit our technology page or review the Tuskegee field results.
Never lose an animal.
Bring us the research question behind your cattle data.
We can show you the field platform at Tuskegee and talk through the views, infrastructure and project scope your university team is considering.
Discuss a university research project →