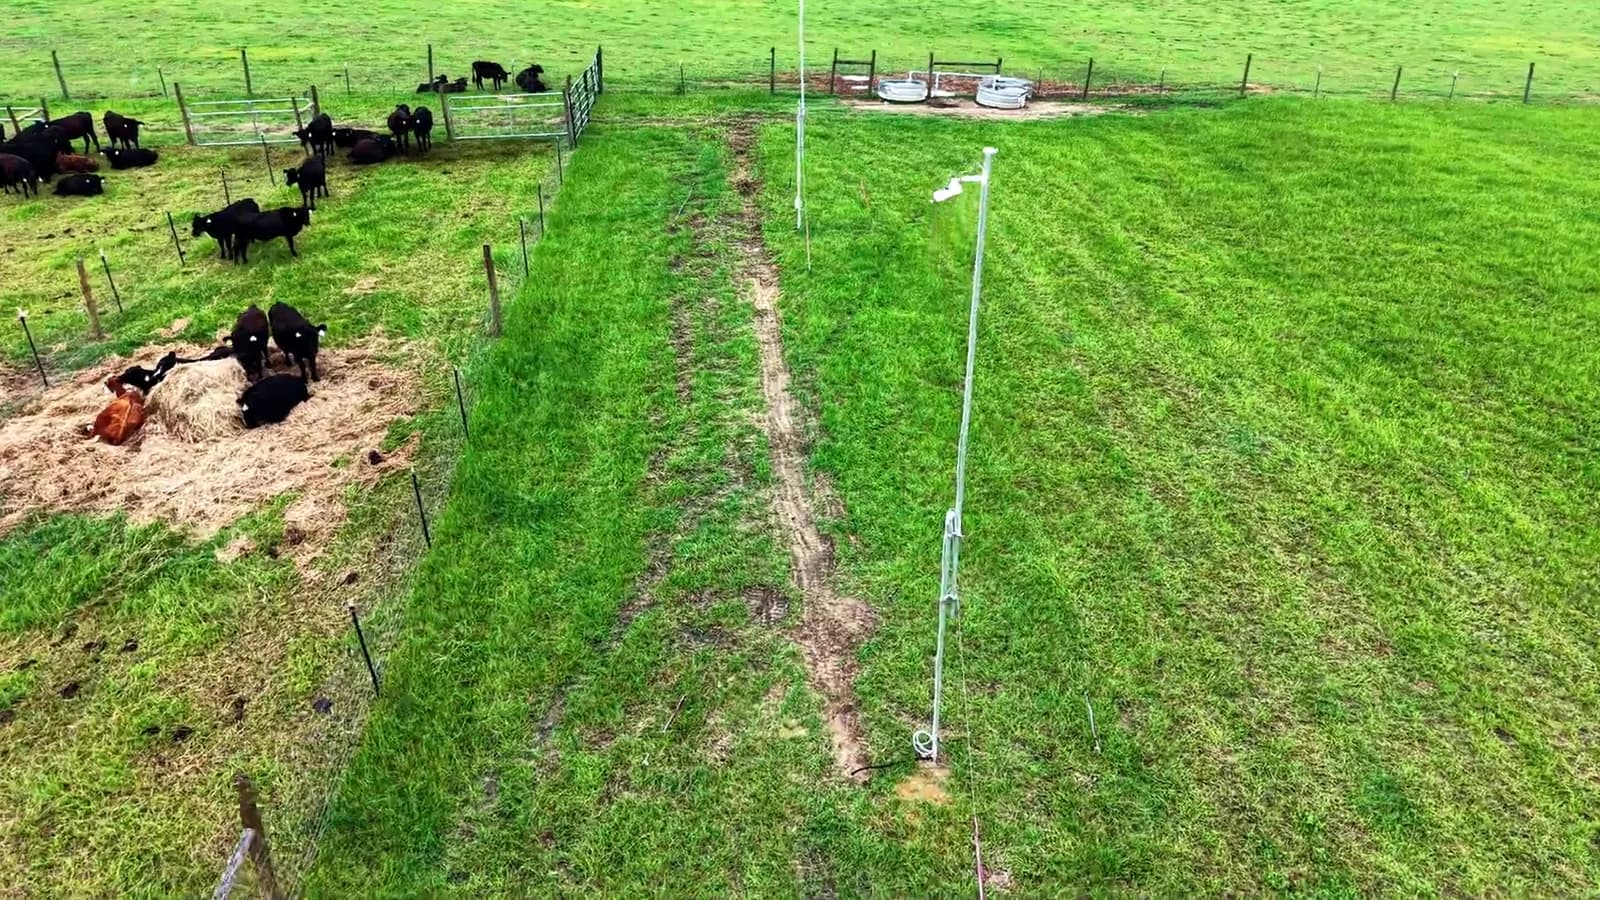
See the cattle and the field setup
The aerial still puts the equipment in its working setting. Cattle occupy several pens beside an installed mast. The Tuskegee field report documents 60 cattle across four pens, solar-powered field nodes, wireless connectivity, and on-site processing and storage.
That matters to a researcher because a camera view is never just a sensor specification. Its position, pen coverage, available light and data path determine which question the study can actually ask. The camera-to-decision workflow starts in this physical environment.
The digital view shows visible activity
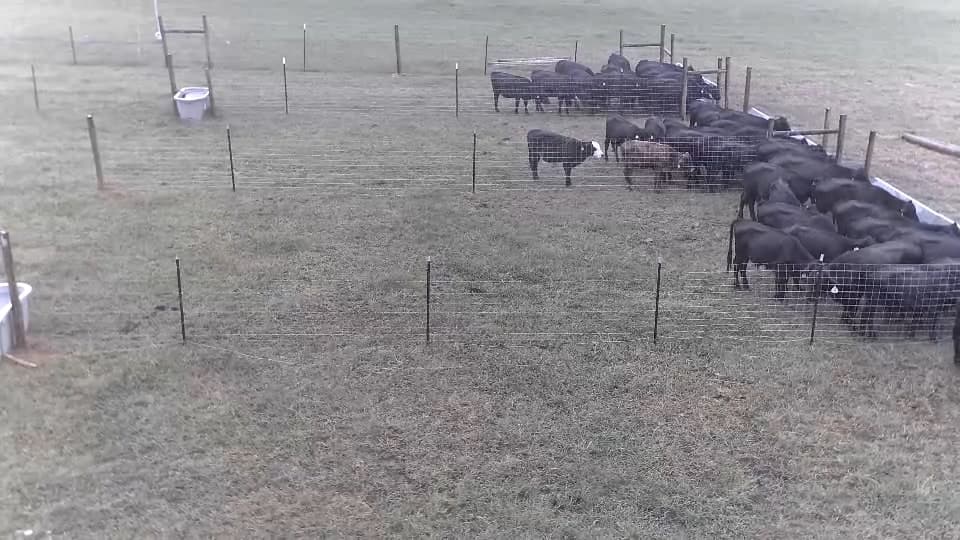
Here, a researcher can point to the bunk area, count cattle visible in that part of the frame, and return to the source clip to examine movement over time. A series of observations could support a question about when cattle approach or leave that zone. Standing at the bunk does not by itself measure how much an animal ate.
The field system supplies continuous capture and cattle-focused computer vision; the research team decides which visible action or location has scientific meaning. Our behavior-video guide shows how to define those labels once the question is chosen.
The thermal views carry observation into the night
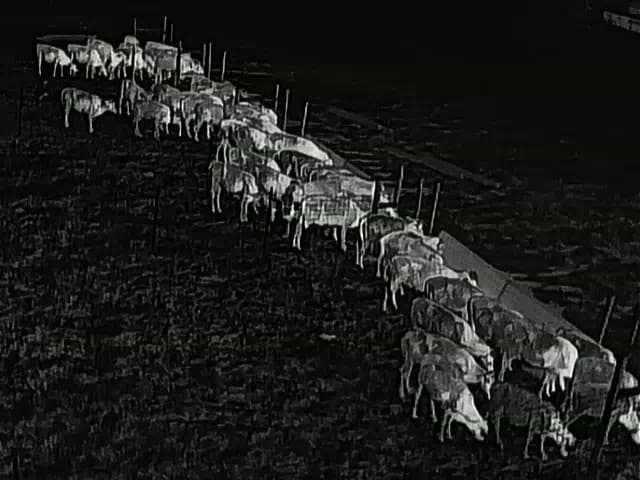

These are real frames from different cameras and times, not a synchronized before-and-after pair. Thermal contrast helps keep animal shapes visible when a normal color frame would lose detail. It shows surface-radiation patterns, not an animal's internal temperature or a diagnosis; veterinary conclusions need their own measurements and protocol.
For a nighttime activity study, a university team could define a pen zone and compare observed presence across selected hours, while documenting when cattle are hidden or outside the view. The answer would be about visible behavior in that study—not a promise that every animal is always visible.
Turn the views into one answerable study
Example: when do cattle use the bunk overnight?
Choose the pen and hours, define what counts as being at the bunk, then inspect sample clips from both daylight and overnight conditions. Keep the original frames and timestamps connected to each observation so the team can check a surprising result. If the study needs individual intake or body temperature, add the appropriate independent measurement rather than treating camera appearance as that measurement.
This is where the field platform becomes useful: installed cameras, local processing and retained source footage give a research team more than a one-time picture. The team can design a repeatable question around the views the system really provides and review the evidence behind its analysis.
Other university work shows how the question changes the setup. The University of Arkansas paired facial RGB and thermal images with thermometer measurements for a controlled calf-temperature study. Kansas State studied thermal patterns across a pen from a drone. Those are distinct research designs; Tuskegee's installed fixed views offer their own field setting and study opportunities.
Bring us the question, not a finished specification
If your group is planning an animal-science study, start with the behavior or condition you want to understand, the cattle and pens involved, and the observation period. We can discuss which views and data outputs fit that question, what is already installed at Tuskegee, and what would need to be scoped for your site.
Our research platform overview and ungated capabilities brief are easy to share with investigators and equipment decision-makers before a conversation.
Never lose an animal.
See what your research question needs in the field.
Tell us the study question and where it would run. We'll discuss the camera views, field infrastructure and research outputs your team would need to evaluate.
Discuss a research partnership →