Ask what the images add to a measurement you already have
A university sheep team may already weigh animals at the start of a feeding or growth study. That starting weight is a useful prediction input. Before adding an imaging system to forecast final weight, ask whether its body-shape information improves the answer beyond that existing measurement.
This changes the equipment conversation. The goal becomes a better forecast for a defined research interval, rather than simply producing more images or a visually convincing model. Livestock Technologies scopes camera capture, connectivity, processing and retained source footage around that kind of research question; an imaging method and sheep-specific model would be agreed within the project.
A ewe study shows why the baseline matters
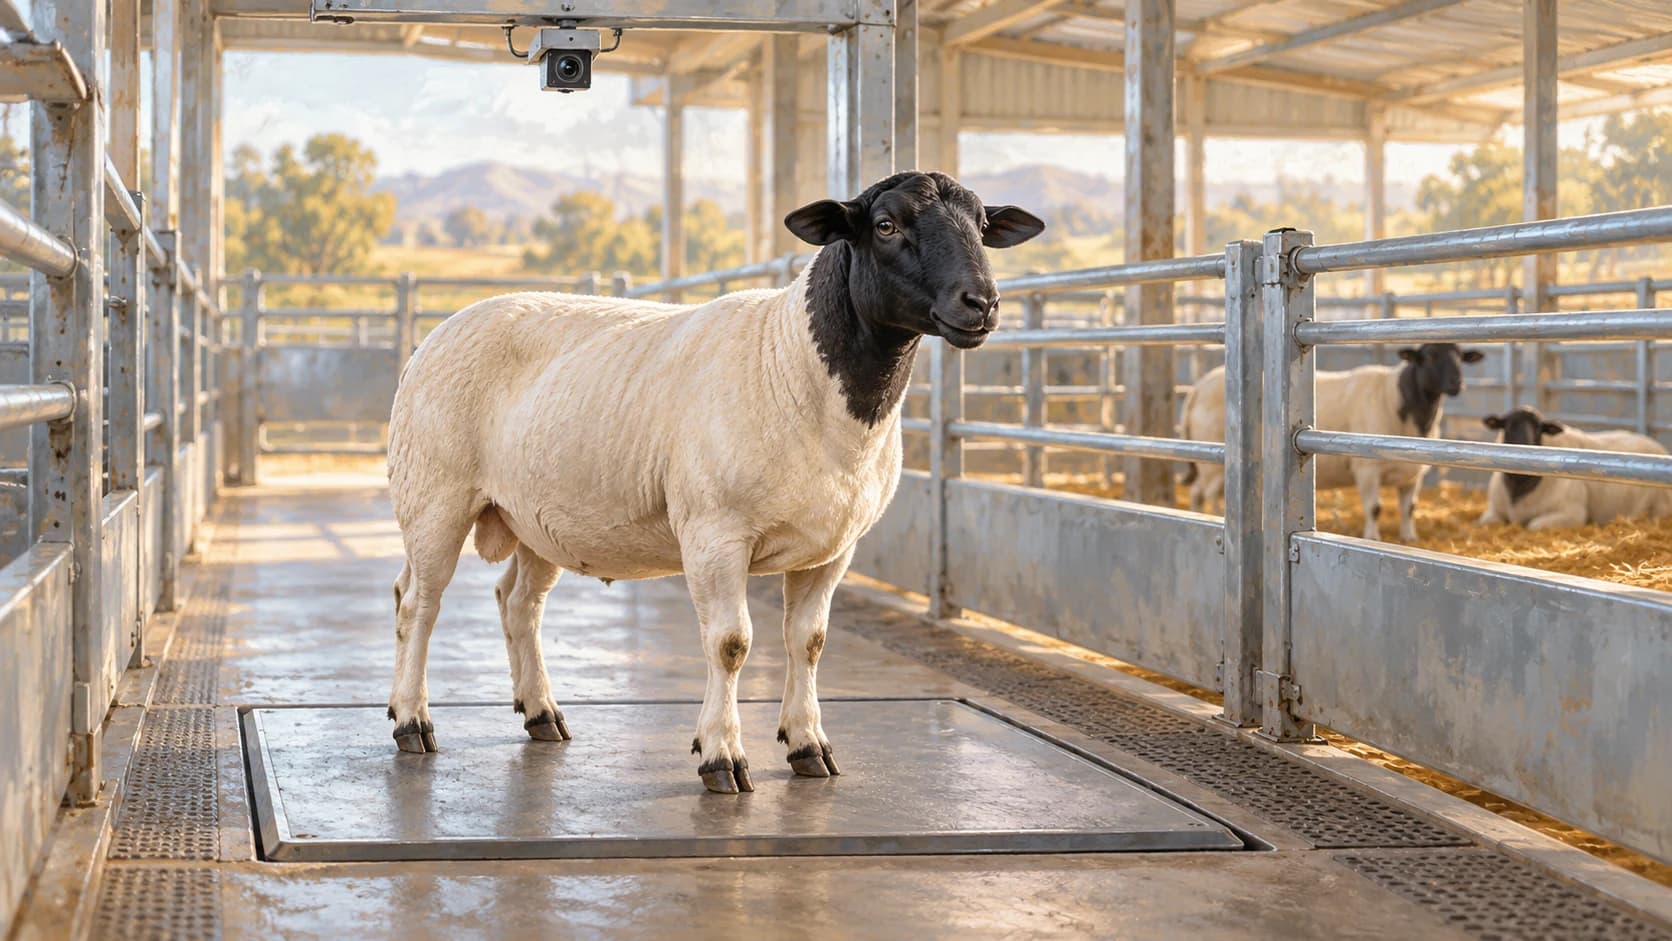
An August 15, 2026 study indexed by the University of Illinois followed 20 Dorper ewes over six sampling periods, pairing overhead depth images with measured weights. The researchers evaluated future-weight prediction separately from estimating weight at the time of imaging.
For final-weight prediction, the study reported R² of 0.770 using starting weight. Adding selected image-derived body measurements reached a reported maximum of 0.839. In contrast, contemporaneous weight estimation reached a maximum R² of 0.332. The authors used nested tests holding out animals and kept preprocessing and model selection inside the training animals.
R² describes prediction error relative to variation in the outcome; it is not a percentage of animals weighed correctly.
Those are different research targets, not interchangeable performance claims. The paper also reported a conditional R² of 0.98 for its longitudinal mixed model; that fit does not establish a 98%-accurate forecast for a new ewe. These findings describe this small study, not a universal sheep model or company performance specification.
Choose between today's weight and a future weight
“Predict sheep weight” can hide two different jobs. Estimating today's weight asks what an animal weighs when the image is taken. Forecasting final weight asks what it will weigh at a specified later point, using information available earlier.
Write the endpoint as a sentence: “Using information available at the start, estimate each ewe's scale weight at the end of this six-week study.” Six weeks is an illustrative planning interval here, not the published study's stated duration or a recommended biological window.
Then decide when the camera information becomes available. A forecast made at enrollment and an updated forecast made halfway through a trial have different information. Comparing them as if they were the same service could credit imaging for simply observing the animal later.
A useful comparison therefore fixes both the target date and the information cutoff. It also asks the same question of the starting-weight baseline and the model that adds images.
A small worked example makes the extra value visible
Imagine two forecasts evaluated on the same four held-out sheep. One uses starting scale weight; the other adds image-derived measurements. The numbers below are invented solely to demonstrate the calculation. They are not results from the ewe study or a Livestock Technologies trial.
| Sheep | Actual final weight | Baseline forecast | Forecast adding images |
|---|---|---|---|
| A | 50 | 52 | 51 |
| B | 55 | 52 | 54 |
| C | 60 | 63 | 62 |
| D | 65 | 61 | 63 |
The baseline's absolute errors are 2, 3, 3 and 4 kg: a mean absolute error of 3 kg. Adding images gives errors of 1, 1, 2 and 2 kg: a mean absolute error of 1.5 kg. Mean absolute error is the average size of the miss, ignoring whether the forecast was high or low.
That arithmetic answers a practical question in weight units. A real experiment needs enough independent animals and uncertainty estimates to judge whether an apparent improvement is dependable. Four sheep illustrate a calculation; they do not establish a sample-size recommendation.
Also inspect the direction of errors. A forecast that repeatedly overestimates the lightest animals may be less useful than its average suggests. Show the paired errors by animal and weight range, so a favorable total does not hide a recurring miss.
Keep the simple comparison genuinely simple
Start with the records the study already has. Compare the starting-weight model with a second model that adds the proposed image features. Use the same evaluation animals, forecast horizon and allowed information for both.
If the added model also receives later scale weights, a different feeding record or more tuning effort, its result no longer isolates the contribution of images. Those additions may still be useful, but they should be named as part of the comparison.
For repeated images, keep an animal's observations together when evaluating predictions for new animals. The ewe paper's animal-level design is a useful example. Our broader model-validation guide covers the general holdout problem; the distinctive decision here is how much useful forecast information the images add to the baseline.
Match an imaging proposal to the extra information needed
A separate July 6, 2026 CSIRO development report describes an Australian project combining 3D images and RFID references to estimate sheep liveweight and fleece weight. It illustrates a more specific imaging objective than ordinary pen video. The release describes prototypes under development, without a published accuracy figure.
For a U.S. university proposal, name the additional information the project expects to extract: for example, repeatable body-shape measurements that might improve a forecast between scale sessions. Then establish whether the proposed capture method can provide it across the animals and conditions being studied.
Do not choose depth hardware merely because a paper used it. Ask what geometric measurement the model needs and whether the proposed view can supply that measurement. The body-landmark guide explains the earlier step of locating anatomical points; a growth forecast must still show what those measurements contribute to the future outcome.
Livestock Technologies can discuss the observation layout, field connectivity, processing and source-footage workflow with animal scientists and engineers. Our technology overview, documented field infrastructure and university capabilities brief give a concrete starting point for that collaboration.
Never lose an animal.
Bring the sheep question and the baseline.
Tell us what your team measures today, what future outcome it wants to forecast and what new information imaging should add. We can discuss a focused research-infrastructure scope around that comparison.
Discuss a sheep research project →