The short answer
The July report shows more cattle on feed, but slower cattle flow during June.
Inventory is a stock measured at a point in time. Placements, marketings, and other disappearance are flows that change that stock. Feedlot teams should read all four together, then reconcile the same categories in their own operating record: opening head count, cattle in, cattle out, documented disappearance, and ending head count by pen.
What USDA reported
Three July numbers belong in the same conversation
USDA's National Agricultural Statistics Service released the July Cattle on Feed report on July 24. It covers U.S. feedlots with capacity of 1,000 or more head and reports the inventory on July 1 plus placements, marketings, and other disappearance during June.
11.37M
On feed July 1
Up 2% from July 1, 2025 in U.S. feedlots with 1,000+ head capacity
1.399M
Placed during June
Down 3% from June 2025
1.661M
Marketed during June
Down 3% and the lowest June marketings in the series that began in 1996
The on-feed inventory was 246,000 head above July 1, 2025. June placements were 42,000 head lower than a year earlier, while marketings were 46,000 head lower. Other disappearance was 50,000 head. A higher ending inventory alongside slower June placements and marketings is a direct reminder that inventory level and monthly throughput answer different questions.
The report also shows the weight distribution of June placements: 325,000 head under 600 pounds, 225,000 at 600-699 pounds, 300,000 at 700-799 pounds, 309,000 at 800-899 pounds, 160,000 at 900-999 pounds, and 80,000 at 1,000 pounds or more. That mix matters to procurement and production planning, while the pen-level operating record remains the source for cattle actually assigned to a specific yard.
American Farm Bureau Federation's July 28 coverage paired the Cattle on Feed release with the July cattle inventory report. Its economist described early signs of herd stabilization and emphasized that demand, heifer retention, and the phased cattle-port reopening will influence the market over time. Those are planning signals. A feedlot still needs its own current count and movement history.
National report, local record
A national cattle total cannot reconcile a specific pen
USDA's Cattle on Feed report helps operators understand national placements, marketings, and the number of cattle on feed. It cannot show which animals entered Pen 14, which ones moved, or whether the expected pen count still agrees with what the yard can observe today.
That local answer needs a dated movement record and a repeatable observation layer. Compare expected inventory with observed evidence, review the exceptions, and send the crew to the pens that need a closer look instead of starting another yard-wide recount.
The feedlot cattle inventory guide explains the pen-count system in detail. The August cattle-port receiving plan covers incoming-load preparation.
The operating equation
Opening inventory plus cattle in, minus cattle out, should equal the ending count
At national scale, NASS organizes cattle flow into placements, marketings, other disappearance, and ending inventory. At yard scale, the labels are more detailed: receiving load, processing, pen transfer, hospital pull, hospital return, shipment, mortality, and any other approved inventory adjustment.
The arithmetic is simple. The handoffs are where discrepancies begin. A load may be received before its final pen is posted. A hospital move can be visible in the yard before the record is closed. A gate passage can send cattle to the right alley but the wrong pen. A shipment may clear the loadout while one source pen still carries the old expected count.
Feedlot inventory audit
Five steps from expected count to a closed exception
Freeze the expected count at a known cutoff
Start with the head count assigned to each lot and pen at the opening of the audit window. Record the system timestamp, data owner, and any loads or shipments already in motion so the comparison has a clean starting point.
Post every cattle-flow event
Add receiving placements, processing moves, hospital pulls and returns, pen transfers, loads, shipments, mortalities, and other documented disappearance. Each event needs an origin, destination, count, time, and responsible record owner.
Compare the observed pen inventory
Use the approved count method for the operating question: crew count, aerial audit, fixed-camera observation, or a controlled count point. Keep the observed number beside the expected number instead of overwriting either one.
Review the exception, not the whole yard
Route a mismatch to the person who owns that pen or movement. Review the narrow time window, gate or alley passage, processing record, and available camera evidence that could explain the difference.
Close the cause and preserve the evidence
Resolve the location, post the missing movement, correct the approved record, or keep the issue open with an owner and next check. A closed exception should show the cause, supporting record, reviewer, and close time.
Where cameras fit
Keep the expected record, observed count, and movement evidence connected
Livestock Technologies builds fixed-camera cattle intelligence for commercial feedlots and animal-science researchers. The inventory workflow begins with the count your yard record expects, compares it with observed cattle presence, and routes the remaining mismatch to a person for review.
Cameras add value between controlled reads and manual audits. A pen view can support an observed count. A gate or alley view can narrow when cattle moved. A chute passage can associate visible references with EID/RFID and the processing record. The result is an evidence packet connected to the operating record, not another video wall for the crew to watch.
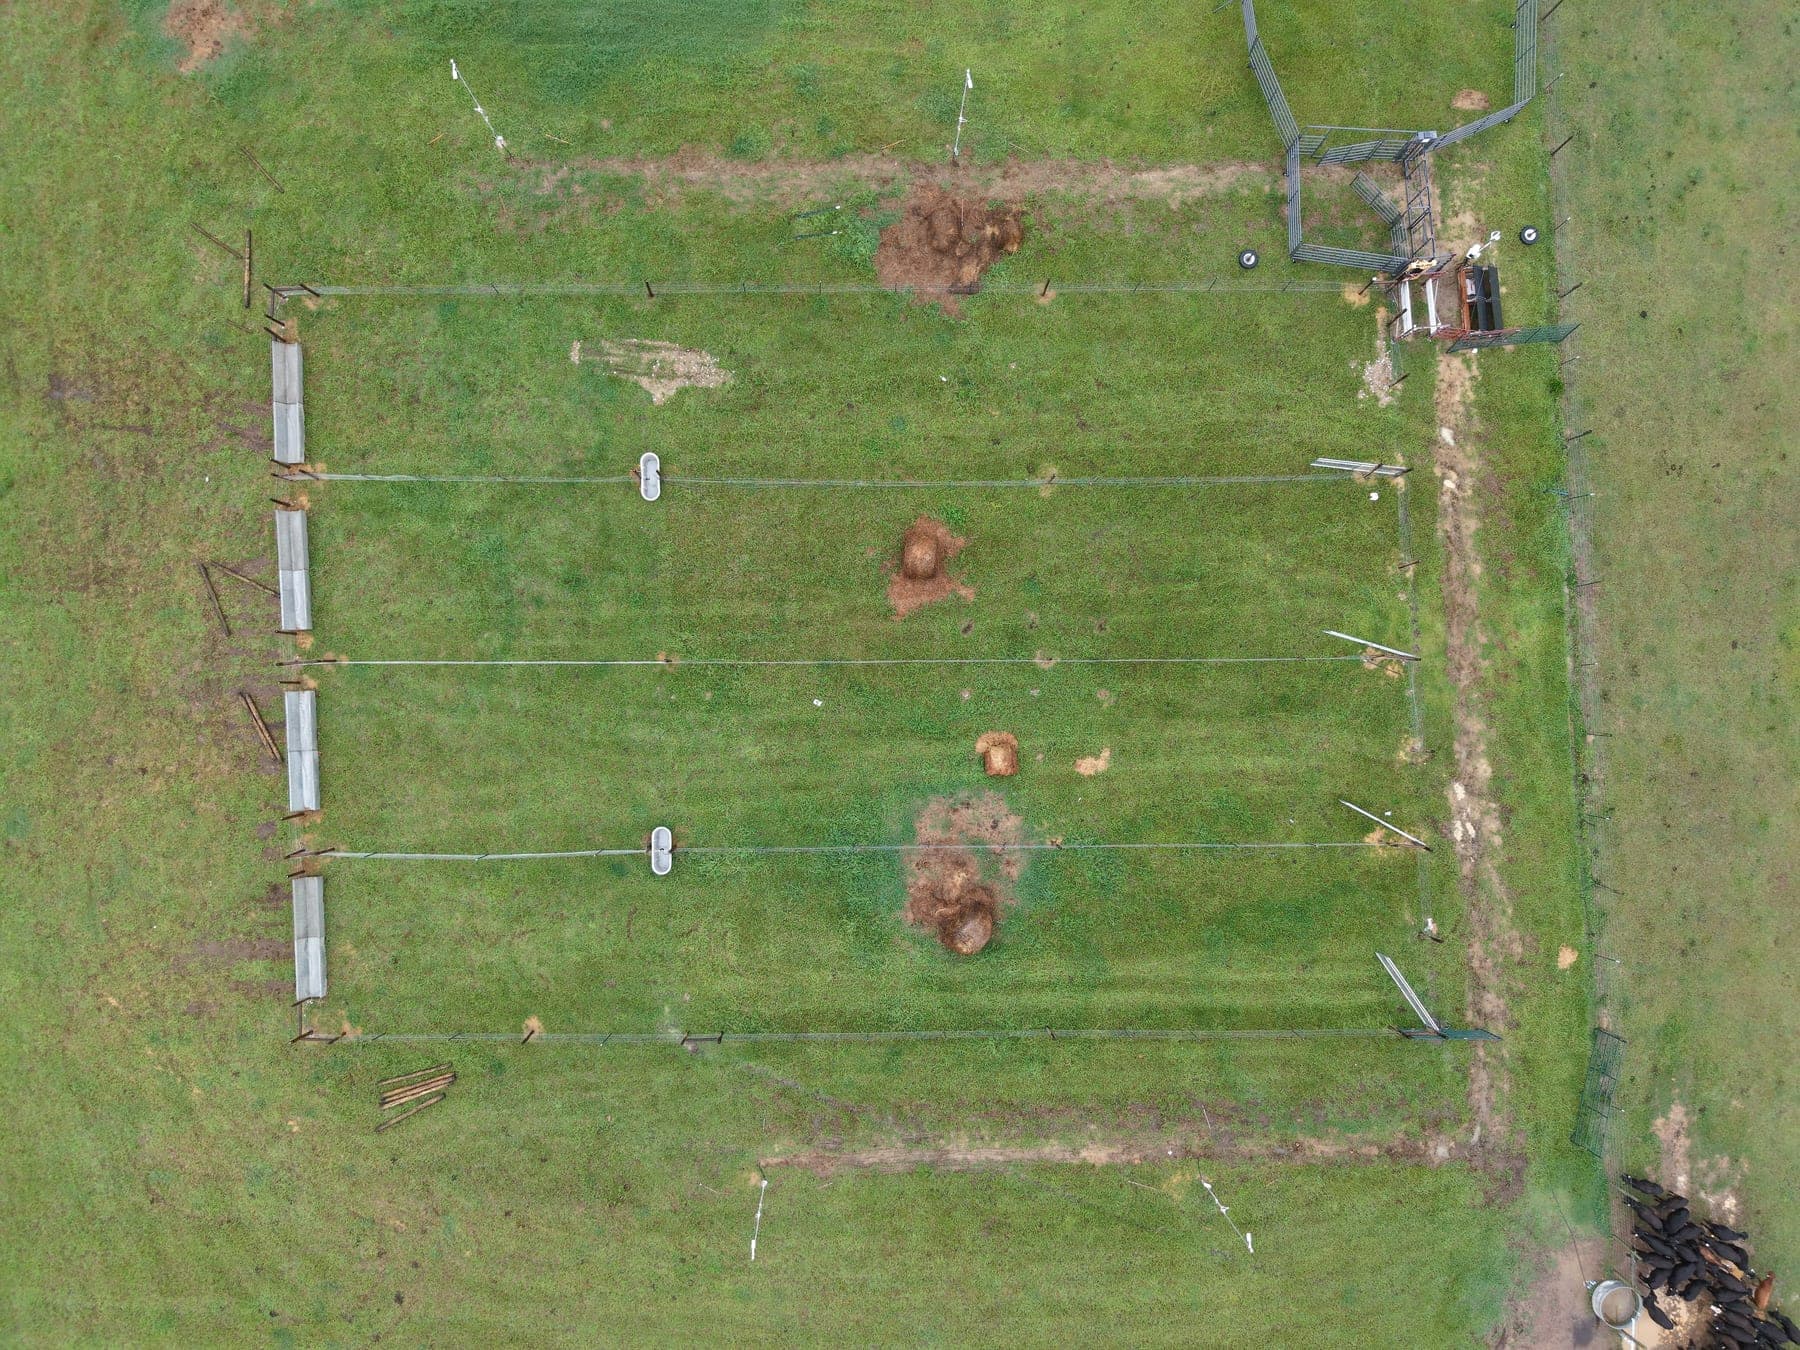
The June 2026 Tuskegee University field deployment documents four research pens, RGB and thermal cameras, solar field nodes, wireless connectivity, on-site compute, and controlled chute-reference capture. A commercial pilot starts with the same discipline: map the yard, name the count and movement questions, define visibility conditions, and agree on who closes each exception.
Management review
Six questions for the next inventory meeting
- Does every pen have an expected count tied to a timestamp and system owner?
- Are receiving, processing, hospital, transfer, shipment, and mortality events posted once and in sequence?
- Which pens have an observed-versus-expected mismatch right now?
- Can the team retrieve the relevant gate, alley, chute, or pen evidence without searching a full day of video?
- Are unresolved exceptions aging with a named owner and next review time?
- Do recurring causes point to a process handoff that needs attention?
Track the operational measures that improve the handoff: exceptions opened by cause, time to first review, time to close, reopened exceptions, unresolved age, and the percentage of moves that arrived with complete origin, destination, count, and timestamp. Keep those yard measures separate from the national market statistics in the USDA release.
For commercial feedlots
Bring the yard map and one inventory question.
We will map the expected counts, known movement events, camera coverage, review owner, and acceptance criteria for a bounded inventory-reconciliation pilot. Start with the pens where a shorter exception list would matter most.
Sources and current data
- USDA NASS: Cattle on Feed, released July 24, 2026
- USDA NASS: United States cattle inventory, July 2026
- American Farm Bureau Federation: USDA reports provide insight into cattle markets
Published August 4, 2026. USDA inventory releases are point-in-time national and state estimates for the populations defined in each report. Use current USDA releases for market context and the operation's approved records and count methods for yard decisions.