Beef prices reflect a chain of connected markets rather than one switch. The available cattle supply sets an important foundation, while feed and yard costs, processing conditions, transportation, retail product mix, promotions, and consumer demand help shape what shoppers see at the meat case.
The most useful way to read the market is source by source: USDA for cattle inventory, the Bureau of Labor Statistics series for retail price history, and clearly dated industry surveys for specific shopping baskets.
Start with the current cattle supply
USDA's cattle inventory reports count cattle and calves, beef cows, replacement heifers, and the calf crop. Those categories show both the animals available now and the breeding decisions that influence future supply. Because herd expansion moves through breeding, calving, growing, and finishing, changes in supply unfold over multiple production stages.
National inventory data is the right reference for the broad market. Individual feedlots still make decisions from their own receiving schedules, pen inventories, movements, feed program, cattle condition, contracts, and shipping windows.
Five parts of the beef price story
Cattle supply
Breeding-herd decisions, calf crops, weather, and the biological time required to raise cattle shape how many animals move through the supply chain. USDA inventory releases provide the national reference point.
Feed and yard costs
Ration ingredients, forage availability, labor, animal care, financing, and days on feed affect the cost of finishing cattle. The mix differs by operation and changes over time.
Processing capacity
Plant availability, labor, scheduling, product mix, and utilization influence how cattle become boxed beef. Regional conditions can matter even when national totals look stable.
Transportation and distribution
Cattle, feed, refrigerated beef, packaging, and people all move through fuel- and labor-dependent networks. Distance, timing, and cold-chain requirements shape delivered cost.
Retail and consumer demand
Retailers price a mix of cuts, promotions, inventory, shrink, labor, and local demand. Ground beef, steaks, and roasts can move differently because they use different parts of the carcass and serve different markets.
These factors interact. A tighter cattle supply can coincide with changing feed costs, uneven regional processing conditions, or a different retail mix. A single weekly price or shopping-basket survey is a dated observation, while a published series shows how the measure moves over time.
Where feedlot evidence improves decisions
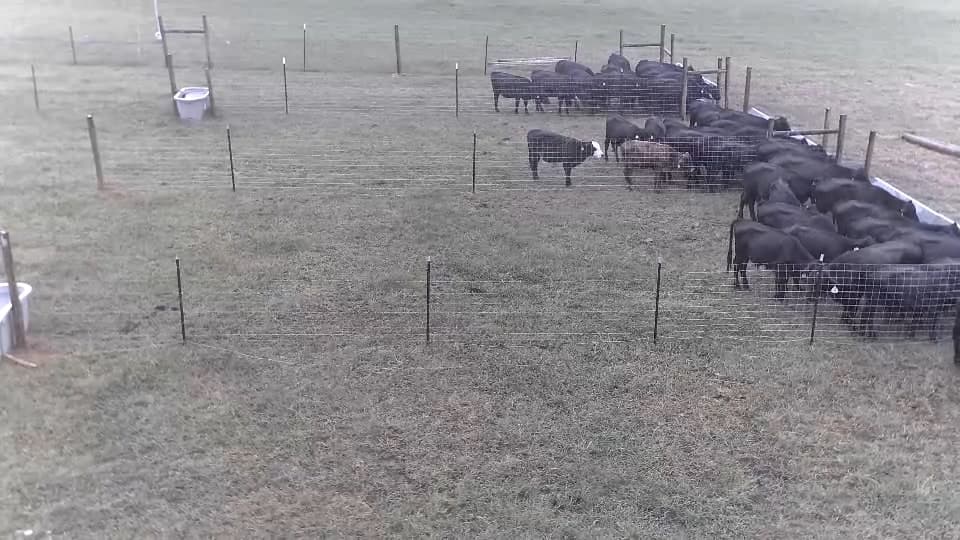
Feedlots operate inside this national market but manage site-level questions. Better inventory and movement evidence helps teams reconcile what was expected with what was observed, preserve unresolved exceptions, and retrieve the right event when records need review.
| Operating question | Authoritative records | Supporting observation evidence |
|---|---|---|
| How many cattle should be in this pen? | Receiving, processing, transfer, hospital, return, and shipping records | Observed pen presence, review windows, and a preserved exception when expected and observed counts differ |
| Where did a movement mismatch begin? | Time-stamped movement records and destination assignments | Reviewable camera observations around gates, alleys, and pen boundaries tied to the relevant time window |
| What happened around the bunk? | Feed delivery, ration, weather, and crew notes | Zone-level activity observations that can be compared with direct measurements and staff observations |
| Which event needs a person first? | Operational priority, responsible owner, and escalation rules | An exception queue with source imagery, time, location, visibility, and review status |
A practical inventory and movement workflow
- Define the expected state. Start with receiving, processing, current pen, hospital, transfer, and shipping records.
- Compare a bounded review window. Use time-and-place observations for the pen, gate, alley, or bunk zone tied to the question.
- Keep exceptions visible. Record missing views, occlusion, uncertain counts, and unmatched movements as review states.
- Assign ownership. Route each exception to the person responsible for the operating record or animal-care decision.
- Measure the workflow. Track review time, exception volume, resolved causes, coverage, and the burden placed on staff.
The result is a clearer evidence chain for operational decisions: source record, observed event, confidence or missing state, reviewer, and resolution. That evidence can support receiving, pen reconciliation, movement review, and audit preparation without turning a national market trend into a site-level performance claim.
Read the source series directly
Make inventory and movement exceptions reviewable
Start with one bounded feedlot workflow, the records that control it, and clear acceptance criteria for the observation evidence.